Why Is Employee Turnover So Complicated?

Employee turnover is the basic metric which everybody knows and tracks. This indicator lands on all dashboards and is considered within every workforce planning.
However, to get real value from tracking turnover, we should consider the context, focus on key employee populations, and learn how to provide insights.
Employee Turnover
Employee turnover has financial and operational implications for organizations. It is rate at which employees are leaving the organization in a given time period. The way of calculating employee turnover often differs and can be adjusted due to specific nature of an organization.
The vanilla turnover rate includes employer intended and employer unintended leaves.
Employer unintended leaves divide into voluntary leaves and all others.
Voluntary leaves are employee resignations and retirements. All others employer unintended leaves are: death, incarceration, job abandonment, refusal to accept new assignment, etc.
Employer intended are involuntary leaves. It means that employee is laid off or terminated.
(We can also track regrettable and non-regrettable turnover, but I won’t cover it in this article.)
In the analysis of turnover risk we focus on voluntary leaves. This is the most relevant category for analysis.
The overall turnover reporting isn’t offering many insights. Putting the whole population of voluntary, involuntary, and all others leaves to one bucket gives us the rate, but it’s difficult to interpret. For somebody who sees the indicator for the first time, or works with it rarely, it can be vague.
Much more sense has to focus on specific employee populations, like: top performers, new hires, poor performers, successors, high potentials, key positions, or high risk employees. There groups turnover has significant impact on the organization. Therefore, such metric can definitely improve decision making.
The turnover formula is pretty simple:
(Number of separations during the time period / average actual number of employees during the time period) * 100
Typically, the time periods we track the indicator are year, quarter, month, or pay period.
Now, the controversial part is whether we use average number of employees in the denominator, or the number of employees in the beginning of the period. Honestly, I don’t think this is very crucial decision to make. Check what is your market standard, or the formula used by the vendor offering you the market benchmark, and follow it. It might have sense to use average if you measure longer time period, and the number from the beginning of the period if you measure turnover over short time period. Yet, it’s all about the insights and recommendations for your organization. Don’t waste too much time on theoretical disputes.
Cost of Turnover
Gallup:
“The cost of replacing an individual employee can range from one-half to two times the employee's annual salary.”
Gallup reports that voluntary turnover in the US costs companies up to $1 trillion annually. What is important, significant portion of these costs are preventable.
How to get to know, how much voluntary employee turnover costs my organization? We can calculate that. And it’s fun to do that, so fasten your seatbelts!
(I know it might not sound like fun, but believe me, revealing insights is extremely satisfying, so bear with me and start calculating.)
Cost of turnover includes, but is not limited to:
- Separation pay (unused holiday days, severance pay, compensation, etc.)
- Payables to temps and contractors (temporary replacement of an employee who left)
- Overtime pay to other employees (to cover work of employee who left)
- Staffing costs for replacement hiring
- Onboarding cost
- Loss of revenue (time to productivity; new employee won’t perform 100% from the start)
Additionally, there are aspects difficult to quantify, like:
- Damage to customer relationships
- Temporary or long‐term productivity and performance differentials
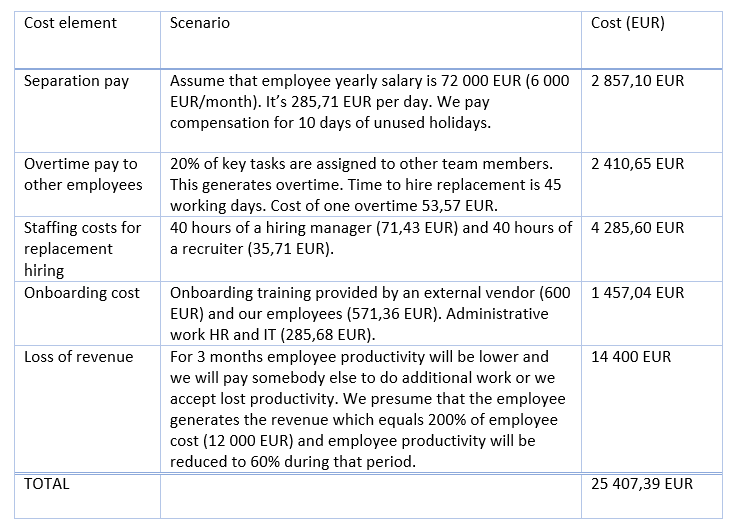
Table above shows a hypothetical example of turnover cost. This simplified calculation inclines that the cost of turnover is approximately 35% of employee annual salary. Most likely your company has other context, so the cost elements will be different.
Calculate what is your organization cost of turnover, present it to your manager, and start a dialogue. The results can be astonishing!
Turnover Contagion
So we know that turnover generates cost. However, that’s not the end. Prepare for the worst. Turnover is contagious!
As I described in one of the previous posts:
“Turnover contagion is defined when employees are transmitting their intention to leave to people around them. It occurs because we tend to compare ourselves to others or imitate others’ withdrawal from the organization.”
People naturally look to others. This includes when making decisions about whether or not to start looking for another job. Employee resignation is not isolated event but happens in a social setting.
Watch out for employees’ pre-quitting behaviors such as decreased productivity, low commitment to long term timelines, or leaving the work early more frequently than usual.
Be aware of the time span after a team member’s resignation as the risk of subsequent resignation is increased most for 135 days after the first team member’s resignation.
Turnover Implications on Organizations
We have a good reason to search for insights related to employee turnover. Gallup, in the research mentioned earlier, highlights that a significant portion of turnover costs are preventable. Many employees leave their jobs because they feel undervalued, and their managers or organizations fail to engage them effectively. Having meaningful conversations about employees' job satisfaction and future, managers can potentially prevent a large number of voluntary leaves. It is important to address employee concerns and aspirations to retain talent and reduce financial losses due to turnover.
In other words, we track turnover rate to reveal insights to identify where to support managers and vice versa. We work on employee engagement, performance, employee listening, and learning & development, to reduce turnover.
London School of Economics conducted a meta-analysis of 339 independent studies, including the wellbeing and productivity of 1 882 131 employees and the performance of 82 248 business units, originating from 230 independent organisations across 49 industries in 73 countries.
The analysis revealed a strong positive correlation between employee satisfaction and key performance indicators like customer loyalty, productivity, and profitability, while also noting a significant negative correlation with employee turnover. The findings are consistent across industries and regions, suggesting severe impact of employee turnover on company performance and revenue.
Additionally, there are hidden cost of employee turnover.
A study by Wharton's Ken Moon conducted with a major Chinese smartphone manufacturer, found a direct link between higher worker turnover rate and product failure. Key findings include that each percentage point increase in weekly turnover rates led to a 0.74% to 0.79% increase in product failure. The study emphasizes that turnover impacts not only recruiting and training costs but also product quality and reliability, leading to significant financial consequences.
We learned that turnover is costly and mostly unwanted phenomenon. Although, there is a healthy turnover rate, as each company needs to let in some refreshing force from time to time, uncontrolled turnover can lead to severe productivity, quality, and financial consequences.
Calculating vanilla turnover might not be the best idea, but as soon as we learn how to measure and focus on specific population, we can enable insights and provide recommendations which will improve business outcomes and employee experience.
Sources:
- https://www.gallup.com/workplace/247391/fixable-problem-costs-businesses-trillion.aspx
- https://blogs.lse.ac.uk/businessreview/2019/07/15/happy-employees-and-their-impact-on-firm-performance
- https://knowledge.wharton.upenn.edu/article/why-employee-turnover-costs-more-than-you-think/
Inspiring Quote
Morgan Housel:
“Saying "I'm in it for the long run" is a bit like standing at the base of Mount Everest, pointing to the top, and saying, "That's where I'm heading." Well, that's nice.
Now comes the test.”
Want to be a Sponsor?
Would you like to be a sponsor of my newsletter? Contact me: sebastian@szachnowski.com.
Thank you for reading my newsletter! I’ll be delighted to get your feedback about the newsletter and this issue.
Do you know someone who might be interested in this newsletter? Share it with them.
You can also:
- Subscribe to my newsletter https://szachnowski.com/
- Connect with me on LinkedIn https://www.linkedin.com/in/sebastianszachnowski/
- Follow me on X https://x.com/sszachnowski
- Send me an email sebastian@szachnowski.com